Linux系统监控常用命令
掌握Linux系统监控命令是后台开发人员必备技能,而且也便于在性能测试的时候,发现系统的瓶颈点,本文简单描述了一下常用命令(也收集了一些比较优秀的文章)。
CPU
- top
字段不多做解释了,可以
man top
top - 22:08:32 up 218 days,  6:50,  1 user,  load average: 1.01, 0.56, 0.39
Tasks: 183 total,   1 running, 182 sleeping,   0 stopped,   0 zombie
%Cpu(s):  3.8 us,  0.3 sy,  0.0 ni, 95.5 id,  0.4 wa,  0.0 hi,  0.0 si,  0.0 st
KiB Mem : 16136776 total,   440256 free,  8399328 used,  7297192 buff/cache
KiB Swap:  2088956 total,  2030900 free,    58056 used.  6759784 avail Mem

  PID USER      PR  NI    VIRT    RES    SHR S  %CPU %MEM     TIME+ COMMAND
    1 root      20   0  192600   2768   1348 S   0.0  0.0  27:53.99 systemd
    2 root      20   0       0      0      0 S   0.0  0.0   0:02.08 kthreadd
    3 root      20   0       0      0      0 S   0.0  0.0   1:14.90 ksoftirqd/0
    5 root       0 -20       0      0      0 S   0.0  0.0   0:00.00 kworker/0:0H
    7 root      rt   0       0      0      0 S   0.0  0.0   2:26.00 migration/0
    8 root      20   0       0      0      0 S   0.0  0.0   0:00.00 rcu_bh
内存
- free
$ free
              total        used        free      shared  buff/cache   available
Mem:       16136776     8398632      432784      860916     7305360     6760352
Swap:       2088956       58056     2030900
磁盘
- iostat
$ iostat -d -x 1
Linux 3.10.107  2018年12月13日  _x86_64_        (8 CPU)

Device:         rrqm/s   wrqm/s     r/s     w/s    rkB/s    wkB/s avgrq-sz avgqu-sz   await r_await w_await  svctm  %util
sda               0.04    10.47    0.16    6.03     7.71   180.52    60.81     0.07   11.06    9.27   11.11   5.21   3.22

Device:         rrqm/s   wrqm/s     r/s     w/s    rkB/s    wkB/s avgrq-sz avgqu-sz   await r_await w_await  svctm  %util
sda               0.00     4.00    0.00    2.00     0.00    24.00    24.00     0.02   10.00    0.00   10.00  10.00   2.00
网络
- netstat
$ netstat
Active Internet connections (w/o servers)
Proto Recv-Q Send-Q Local Address           Foreign Address         State
tcp        0  37321 10.224.139.153:35076    10.58.93.:commplex-main FIN_WAIT1
Active UNIX domain sockets (w/o servers)
Proto RefCnt Flags       Type       State         I-Node   Path
unix  2      [ ]         DGRAM                    639964932 /usr/local/sa/agent/log/agent_cmd.sock
unix  2      [ ]         DGRAM                    907      /run/systemd/notify
unix  3      [ ]         STREAM     CONNECTED     639969458
unix  3      [ ]         STREAM     CONNECTED     639968806 /usr/local/sa/agent/secubase/secu-tcs-agent-v5.unix
- ss - another utility to investigate sockets
$ ss
Netid State      Recv-Q Send-Q                                                               Local Address:Port                                                                                Peer Address:Port
u_str ESTAB      0      0                                                                                * 536761524                                                                                      * 536761525
tcp   ESTAB      0      0                                                                   10.224.139.153:33592                                                                             10.198.146.155:sun-sr-http
tcp   CLOSE-WAIT 1      0                                                                   10.224.139.153:51441                                                                             10.219.153.217:http
tcp   FIN-WAIT-1 0      38525                                                               10.224.139.153:59964                                                                                10.58.93.68:commplex-main
tcp   ESTAB      0      0                                                                   10.224.139.153:49287                                                                             10.198.146.155:vrace
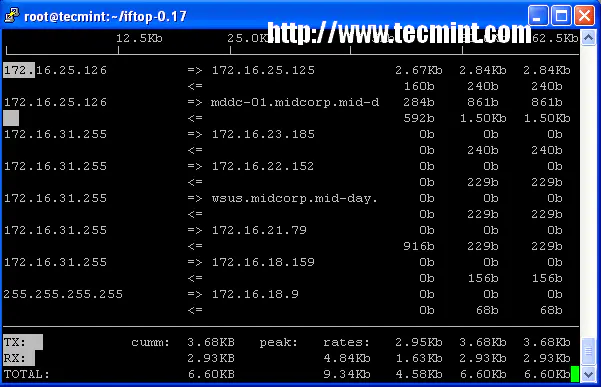
-
iftop — 网络带宽监控 iftop 是另一个基于终端的开源的系统监测工具,主要功能是通过你自己系统上的网络接口显示一个经常更新的网络带宽利用率的列表(即源主机和目的主机)。iftop 监控的是网络的使用情况,而 top 监控的是 CPU 的使用情况。iftop 监视一个选定的接口并且显示两台主机之间当前宽带的使用情况。
综合性命令
- vmstat
$ vmstat 2
procs -----------memory---------- ---swap-- -----io---- -system-- ------cpu-----
 r  b   swpd   free   buff  cache   si   so    bi    bo   in   cs us sy id wa st
 1  0  58056 388084 315464 7035804    0    0     1    23    0    0  4  0 96  0  0
 0  0  58056 389480 315464 7036020    0    0     0     2 2010 3283  6  1 93  0  0
- dstat
$ dstat
You did not select any stats, using -cdngy by default.
----total-cpu-usage---- -dsk/total- -net/total- ---paging-- ---system--
usr sys idl wai hiq siq| read  writ| recv  send|  in   out | int   csw
  4   0  96   0   0   0|7900B  181k|   0     0 | 168B  495B| 732  3171
 11   0  88   0   0   0|   0    64k|  66k   27k|   0     0 |2162  3254
  0   0 100   0   0   0|   0     0 |  16k 6022B|   0     0 |1160  2448
  0   0 100   0   0   0|   0    28k|9023B 5224B|   0     0 |1145  2389
  1   0  99   0   0   0|   0     0 | 128k   48k|   0     0 |2256  3279
  0   0 100   0   0   0|   0   908k|  17k 7332B|   0     0 |1282  2694
  0   0  99   1   0   0|   0    72k| 161k   44k|   0     0 |1689  3117
-
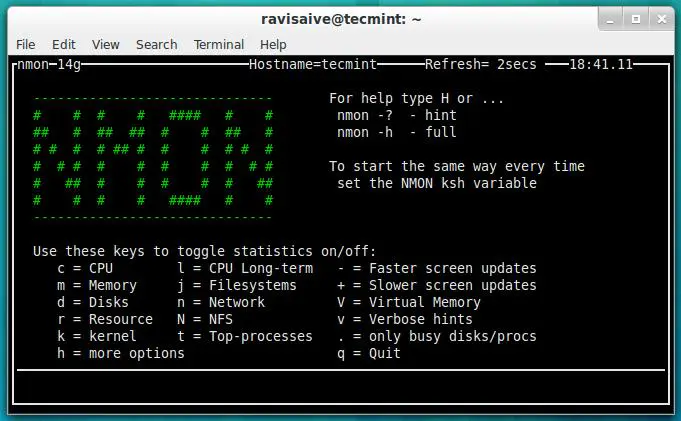
Nmon
Nmon工具用来监视 Linux 系统的所有资源包括:CPU、内存、磁盘使用率、网络上的进程、NFS、
内核
等等。这个工具有两个模式:即在线模式和捕捉模式。在线模式适用于实时监控,捕捉模式用于存储输出为 CSV 格式后的处理。
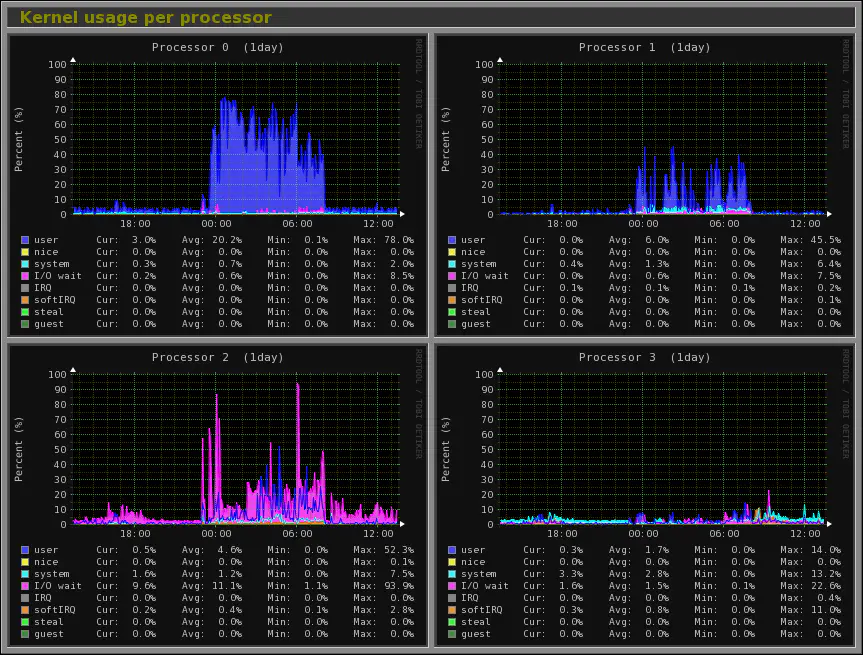
图形界面
Monitorix 是一个尽可能多的在 Linux/Unix 上一个轻量级监控工具,主要设计是监控正在运行的系统和网络资源。它有一个内置的 HTTP web 服务去定期收集系统和网络信息并显示成图片。它可以监视系统的平均负载使用、内存的分配、磁盘驱动器、系统服务、网络端口、邮件统计(Sendmail、Postfix、Dovecot 等等)、MYSQL 数据库等等更多的服务。它的主要目的是监控整个系统的性能,并且有助于监测故障、瓶颈、异常活动等状况。
更多命令

一图掌握所有性能分析工具及分析内容
参考
本文由 创作,采用 知识共享署名4.0 国际许可协议进行许可。本站文章除注明转载/出处外,均为本站原创或翻译,转载前请务必署名。最后编辑时间为: 2020/07/14 14:24