在之前的系列文章中我们学习了如何进行Spring Boot应用的功能开发,以及如何写单元测试、集成测试等,然而,在实际的软件开发中需要做的不仅如此:还包括对应用程序的监控和管理。
正如飞行员不喜欢盲目飞行,程序员也需要实时看到自己的应用目前的运行情况。如果给定一个具体的时间,我们希望知道此时CPU的利用率、内存的利用率、数据库连接是否正常以及在给定时间段内有多少客户请求等指标;不仅如此,我们希望通过图表、控制面板来展示上述信息。最重要的是:老板和业务人员希望看到的是图表,这些比较直观易懂。
首先,这篇文章讲介绍如何定制自己的health indicator。
How Do
- 在pom文件中添加spring-boot-starter-actuator依赖
<dependency>
   <groupId>org.springframework.boot</groupId>
   <artifactId>spring-boot-starter-actuator</artifactId>
</dependency>
-
spring-boot-starter-actuator
这个库让我们可以访问应用的很多信息,包括:/env、/info、/metrics、/health等。现在运行程序,然后在浏览器中访问:
http://localhost:8080/health
,将可以看到下列内容。
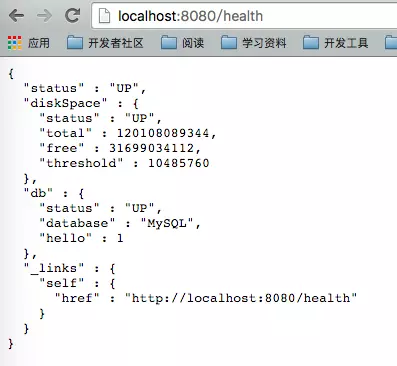
acatuator库提供监控信息
-
除了/health可以访问,其他的Endpoints也可以访问,例如/info:首先在application.properties文件中添加对应的属性值,符号*@*包围的属性值来自pom.xml文件中的元素节点。
info.build.artifact=@project.artifactId@
info.build.name=@project.name@
info.build.description=@project.description@
info.build.version=@project.version@
- 要获取配置文件中的节点值,需要在pom文件中进行一定的配置,首先在
节点里面添加:
<resources>
   <resource>
      <directory>src/main/resources</directory>
      <filtering>true</filtering>
   </resource>
</resources>
然后在
<plugin>
   <groupId>org.apache.maven.plugins</groupId>
   <artifactId>maven-resources-plugin</artifactId>
   <version>2.6</version>
   <configuration>
      <delimiters>
         <delimiter>@</delimiter>
      </delimiters>
      <useDefaultDelimiters>false</useDefaultDelimiters>
   </configuration>
</plugin>
-
然后运行应用程序,访问
http://localhost:8080/info
,可以看到下列信息
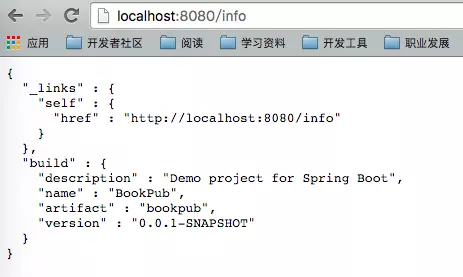
http://localhost:8080/info
-
除了使用系统默认的监控信息,我们还可以定义自己的health indicator。使用Spring Boot:定制自己的starter一文中做过的db-count-starter作为观察对象,我们希望监控每个数据库接口的运行状况:如果某个接口返回的个数大于等于0,则表示系统正常,表示为UP状态;否则,可能该接口发生异常,表示为DOWN状态。首先,将DbCountRunner类中的getRepositoryName方法由private转为protected,然后在db-count-starter这个模块中也添加actuator依赖。
-
在db-count-starter/src/main/com/test/bookpubstarter目录下创建DbCountHealthIndicator.java文件
public class DbCountHealthIndicator implements HealthIndicator {
    private CrudRepository crudRepository;
    public DbCountHealthIndicator(CrudRepository crudRepository) {
        this.crudRepository = crudRepository;
    }
    @Override
    public Health health() {
        try {
            long count = crudRepository.count();
            if (count >= 0) {
                return Health.up().withDetail("count", count).build();
            } else {
                return Health.unknown().withDetail("count", count).build();
            }
        } catch (Exception e) {
            return Health.down(e).build();
        }
    }
}
- 最后,还需要注册刚刚创建的健康监控器,在DbCountAutoConfiguration.java中增加如下定义:
@Autowired
private HealthAggregator healthAggregator;
@Bean
public HealthIndicator dbCountHealthIndicator(Collection<CrudRepository> repositories) {
    CompositeHealthIndicator compositeHealthIndicator = new
            CompositeHealthIndicator(healthAggregator);
    for (CrudRepository repository: repositories) {
        String name = DbCountRunner.getRepositoryName(repository.getClass());
        compositeHealthIndicator.addHealthIndicator(name, new DbCountHealthIndicator(repository));
    }
    return compositeHealthIndicator;
}
- 运行程序,然后访问http://localhost:8080/health,则可以看到如下结果
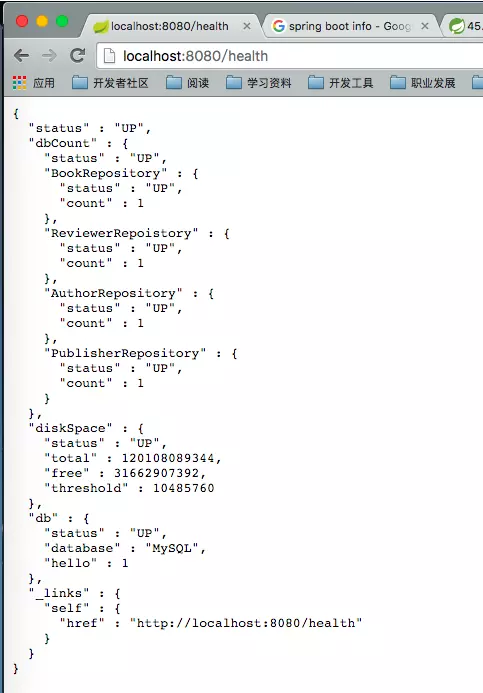
自定义的health indicator
分析
Spring Boot Autuator这个库包括很多自动配置,对外开放了很多endpoints,通过这些endpoints可以访问应用的运行时状态:
-
/env提供应用程序的环境变量,如果你在调试时想知道某个配置项在运行时的值,可以通过这个endpoint访问——访问http://localhost:8080/env,可以看到很多方面的配置,例如,class path resources—[tomcat.https.properties]、applicationConfig—[classpath:/application.properties]、commonsConfig、systemEnvironment、systemProperties等。 这些变量的值由Environment实例中的PropertySource实例保存,根据这些属性值所在的层次,有可能在运行时已经做了值替换,跟配置文件中的不一样了。为了确认某个属性的具体值,例如book.count.rate属性,可以访问http://localhost:8080/env/book.counter.rate来查询,如果跟配置文件中的不一样,则可能是被系统变量或者命令行参数覆盖了。EnvironmentEndpoint类负责实现上述功能,有兴趣可以再看看它的源码;
-
/configprops
提供不同配置对象,例如
WebConfiguration.TomcatSslConnectionProperties
,它与/env不同的地方在于它会表示出与配置项绑定的对象。尝试下访问
http://localhost:8080/configprops
,然后在网页中查询
custom.tomcat.https
,可以看到我们之前用于配置
TomcatSslConnector
对象的属性值(参见:
让你的Spring Boot工程支持HTTP和HTTPS
)。
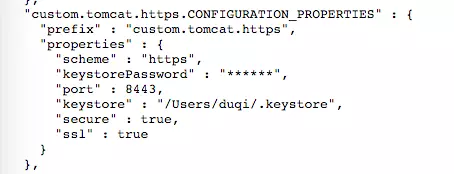
TomcatSslConnector对应的属性值
-
/autoconfig以web形式对外暴露AutoConfiguration 信息,这些信息的解释可以参考Spring Boot:定制自己的starter一文,这样我们就不需要通过“修改应用程序的日志级别和查看应用的启动信息”来查看应用的自动配置情况了。
-
/beans
,这个endpoint列出所有由Spring Boot创建的bean。
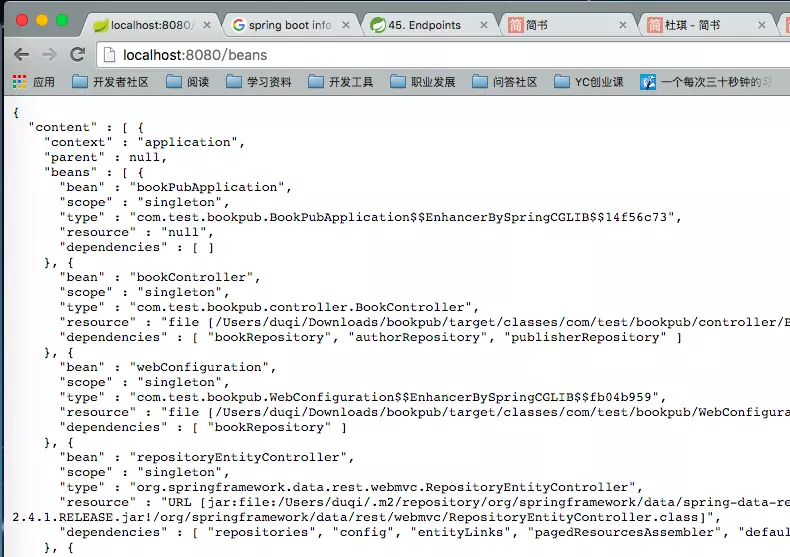
/beans显示所有Spring Boot创建的bean
-
/mapping
,这个endpoint显示当前应用支持的URL映射,该映射关系由
HandlerMapping
类维护,通过这个endpoint可以查询某个URL的路由信息。
/mappings查看URL映射
-
/info,这个endpoint显示应用程序的基本描述,在之前的实践例子中我们看过它的返回信息,属性值来自appliaction.properties,同时也可以使用占位符获取pom.xml文件中的信息。任何以info.开头的属性都会在访问http://localhost:8080/info时显示。
-
/health提供应用程序的健康状态,或者是某个核心模块的健康状态。
-
/metrics,这个endpoint显示Metrics 子系统管理的信息,后面的文章会详细介绍它。
上述各个endpoint是Spring Boot Actuator提供的接口和方法,接下来看看我们自己定制的HealthIndicator,我们只需要实现HealthIndicator接口,Spring Boot会收集该接口的实现,并加入到*/health*这个endpoint中。
在我们的例子中,我们为每个CrudRepository实例都创建了一个HealthIndicator实例,为此我们创建了一个CompositeHealthIndicator实例,由这个实例管理所有的DbHealthIndicator实例。作为一个composite,它会提供一个内部的层次关系,从而可以返回JSON格式的数据。
代码中的HealthAggregator实例的作用是:它维护一个map,告诉CompositeHealthIndicator如何决定所有HealthIndicator代表的整体的状态。例如,除了一个repository返回DOWN其他的都返回UP,这时候这个composite indicator作为一个整体应该返回UP还是DOWN,HealthAggregator实例的作用就在这里。
Spring Boot使用的默认的HealthAggregator实现是OrderedHealthAggregator,它的策略是手机所有的内部状态,然后选出在DOWN、OUT_OF_SERVICE、UP和UNKNOWN中间具有最低优先级的那个状态。这里使用策略设计模式,因此具体的状态判定策略可以改变和定制,例如我们可以创建定制的HealthAggregator:
最后需要考虑下安全问题,通过这些endpoints暴露出很多应用的信息,当然,Spring Boot也提供了配置项,可以关闭指定的endpoint——在application.properties中配置*
还可以通过设置management.port=-1关闭endpoint的HTTP访问接口,或者是设置其他的端口,供内部的admin服务访问;除了控制端口,还可以设置仅仅让本地访问,只需要设置management.address=127.0.0.1;通过设置management.context-path=/admin,可以设置指定的根路径。综合下,经过上述设置,在本地访问http://127.0.0.1/admin/health来访问健康状态。
可以在防火墙上屏蔽掉不是/admin/*的endpoints访问请求,更进一步,利用Spring Security可以配置验证信息,这样要访问当前应用的endpoints必须使用用户名和密码登陆。
参考资料
本文由 创作,采用 知识共享署名4.0 国际许可协议进行许可。本站文章除注明转载/出处外,均为本站原创或翻译,转载前请务必署名。最后编辑时间为: 2020/05/16 03:44